The Alts 50 Report has been created by Peregrine to:
Less than
40%
of managers have all three social media platforms, the primary tool for protecting Google Page 1
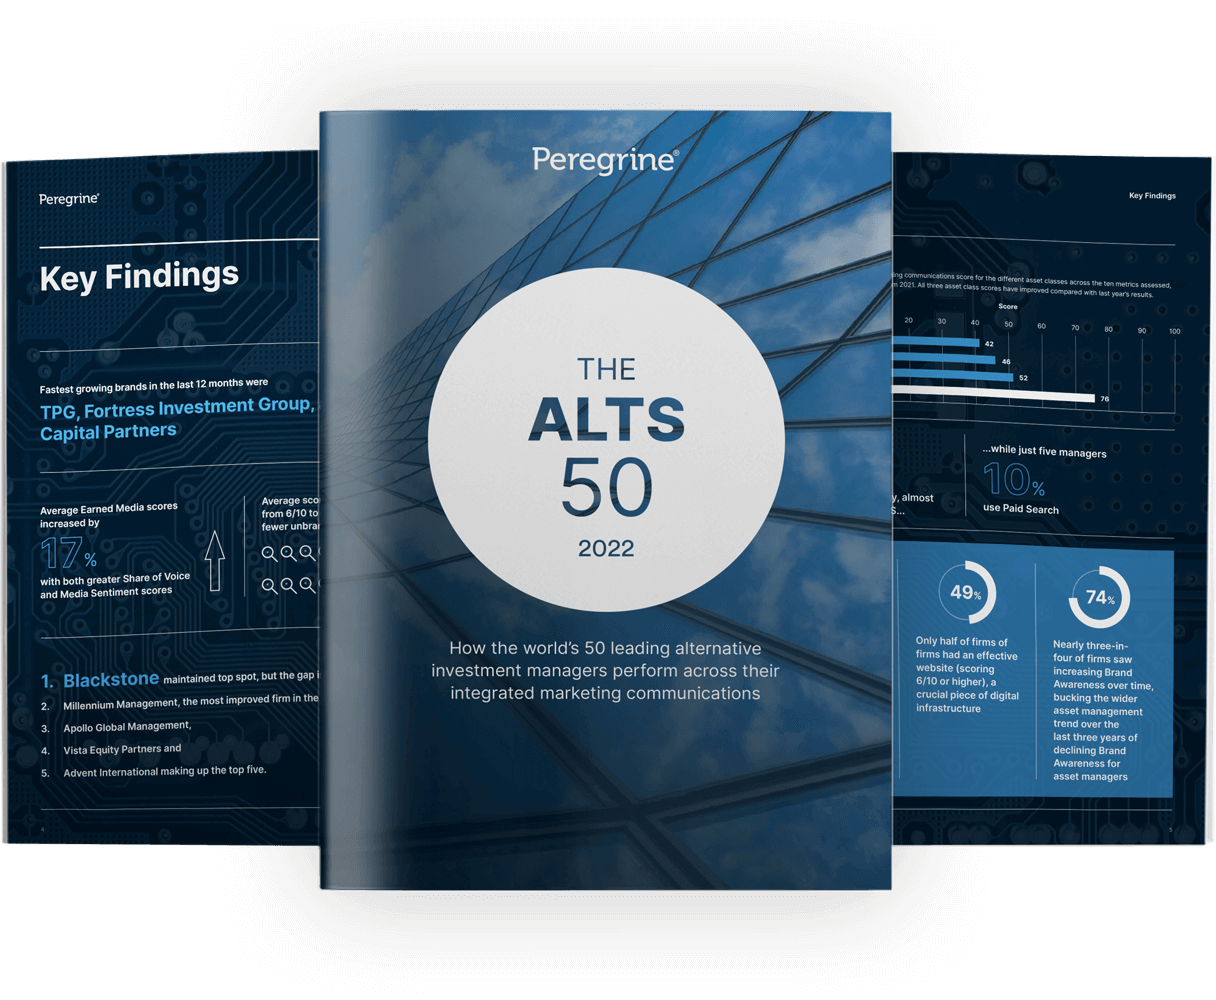
74%
of firms saw increasing Brand Awareness, defying wider industry trend
Average Earned Media scores increased by
17%
with both greater Share of Voice and Media Sentiment scores
| Rank | Company Name | Total/100 |
|---|
Please select two companies to view how they compare against each other across Peregrine’s 10 integrated marketing communications metrics.
Brand build with select leadership profiles to communicate around your market opportunity, edge and corporate culture attributes
Manage your Google Page 1 to work more effectively as a marketing tool to investors, while increasing resilience to potential negative stories
Optimize website to improve user experience and provide clients with higher quality interaction
This report focuses on a research group made up of the largest global investment management firms as ranked by AUM.
Our research analyzes the IMC performance of the 20 largest PE and HF managers, and 10 largest Alternative Credit firms in the world, according to AUM.
These were selected using the following criteria:
To formulate our Brand Awareness score we utilized the average monthly search volume of each brand. Each firm’s score was then weighted against all the other firms analyzed in the study. Firms were evaluated against the most natural, frequently used search terms that their users choose to find them. Care had to be taken in order to differentiate between already large brands and their investment and asset management arms. Although some of these firms may receive additional in-bound search interest through their parent brands, a decision was made to focus purely on the direct search volumes for the specific asset management brand.
Brand Momentum as a metric is intended to show how well each firm is “cutting through” – i.e. increasing the amount of engaged interest it receives over time. While Brand Awareness looks at the absolute volume of Google search for each brand, Brand Momentum assesses the change in search volumes and its increase or decrease over the study period in question. These results are then weighted against all the other scores in the “index” to ensure a meaningful benchmark. Safeguards were also put in place to ensure that no firm would achieve a high score for increasing its Google search volumes as a result of negative news-flow, e.g. a major scandal, sacking of a CEO or financial malfeasance.
Share of Voice ranks firms by how much Tier 1 media coverage they achieved relative to their peers in the rest of the industry over the last twelve months. To avoid skewed results from the inclusion of low value and ‘clickbait’ media coverage, only Tier 1 coverage was measured, taken from a proprietary global Tier 1 investment, business and national media list produced by Peregrine Communications.
Peregrine’s Media Sentiment metric assesses the ratio of positive to negative sentiment achieved by each firm in its media coverage. To ensure robustness of results – given the idiosyncrasies of sentiment analysis tools – multiple sentiment tools were used, and scores aggregated. As with other metrics in this study, each firm’s ratio of positive to negative Media Sentiment was weighted against the rest of the group and scored accordingly.
Our Google Page 1 ranking was scored against a number of criteria designed to indicate how well a firm “owned” the first page of a Google search for its brand search term. This score assesses how well each firm has succeeded in generating positive news stories, an optimized website breakdown, multi-platform Social Media profiles and a side panel further detailing the firm and its history. Firms were penalized significantly for the presence of any negative media or news stories on their Google Page 1s.
To tabulate each firm’s Social Media score across each of the key platforms – LinkedIn, Twitter and YouTube – our framework was created to consider individual core aspects of each firm’s performance for reach, engagement, frequency of posting and quality of content. The metric was designed to take into account both firms’ output as well as their outcomes. The most successful firms had engaging, thoughtful and educational posts that were shared regularly to a large, responsive audience.
Our Search Engine Optimization (SEO) score was awarded through banding scores based on the percentage of “non-branded” search traffic directed to firms’ domain sites. A higher percentage was rewarded with a higher score to reflect a larger proportion of unbranded keyword searches leading to hits on the firm’s site. Firms with a greater degree of sophistication in their SEO campaigns were awarded with a higher score due to their ability to attract investors who do not directly reference their brand when searching for them – indicative of a well thought out keyword search strategy and with content that engages well with target audiences.
Paid Search scores firms based on the amount of estimated traffic generated through their Paid Search campaign. These estimated Paid Search volumes were then compared against the rest of the research group and assigned a score relative to their performance. A number of firms had no evident paid strategy and their scores reflect that fact.
The Paid Media metric was created to analyze the extent to which firms were deploying a paid advertising strategy. The results were generated from data collected into each firm’s volume of recent digital Paid Media (gathered using Peregrine’s ad-tracking tool) as well as tracking “LinkedIn Sponsored Ads”. Firms with paid advertising were scored on a sliding scale dependent on the click-through of those ads, with additional points being awarded for those with a LinkedIn ads campaign to create a score out of 10.
Website Effectiveness is a composite score assessing a firm’s website and its ability to retain viewers and successfully direct investors to areas of interest specific to them. Points were awarded for average page views, average time spent on site and the “bounce rate” at which viewers navigate away from the site having viewed only one page. Points in these three categories were then combined for an overall Website Effectiveness score out of 10.
How the world’s premium alternative investment managers perform across their integrated marketing communications.
Download ReportPlease complete the form below, for unlimited use of benchmarking tool or to download Alts 50 Report 2022.